Building an FGC Transit Realtime Dashboard using GTFS data
TL;DR
I built a small GTFS-Realtime dashboard for FGC (Ferrocarrils de la Generalitat de Catalunya, aka Catalan Government Railways) that shows live vehicle markers with useful information like occupation status + stop popups showing upcoming arrivals, plus two panels listing the most delayed routes and stops historically.
Throughout the project, I practiced:
- GTFS Static (Scheduled) vs Realtime formats (including protobuf decoding)
- Realtime ingestion via HTTP polling in Python, dealing with an unstable/laggy data source and transforming snapshots into JSON for the frontend
- Designing a system that’s reliable and maintainable (idempotent, retry/backoff, dedupe rules, logging, clear data contracts)
- Building and running services with Docker, Dockerfiles, and Docker Compose
- SQLite + SQL for a lightweight historical store and aggregations
- FastAPI for a small REST API serving snapshots + “top delays” endpoints
Important: the deployed GitHub Pages version is just a demo of how it works. It does not use the realtime feeds directly (full explanation at the end, see “Why the GitHub Pages demo loops”).
Intro: what this project is (and what problem it solves)
FGC Transit Realtime Dashboard is a lightweight “GeoTren-ish” dashboard that answers two simple questions:
- What’s happening right now?
Where are the vehicles, what’s their next stop, and what are the upcoming arrivals for each stop? - What’s been historically painful?
Which routes and stops accumulate the biggest average delays? The goal was to build something autonomous, cheap to host, and pleasant to look at, while learning the real-world quirks of GTFS Realtime.
The Beginning: a plan, a dataset… and a wrong assumption
Early on, I picked a GTFS dataset from TITSA thinking it included observed/real operations. It didn’t, it was basically scheduled trips with dates far in the future—useful, but not enough to compute actual delays. That moment forced the first pivot:
- GTFS Scheduled = what should happen (routes, trips, stop_times, shapes)
- GTFS Realtime = what is happening (vehicle positions, trip updates, alerts) — and it comes as protobuf, not JSON Once I accepted “ok, I need GTFS-RT”, I landed on FGC’s realtime feeds and started building around them.
The core architecture: “current state” snapshots + “historic” SQLite
The project follow this architecture:
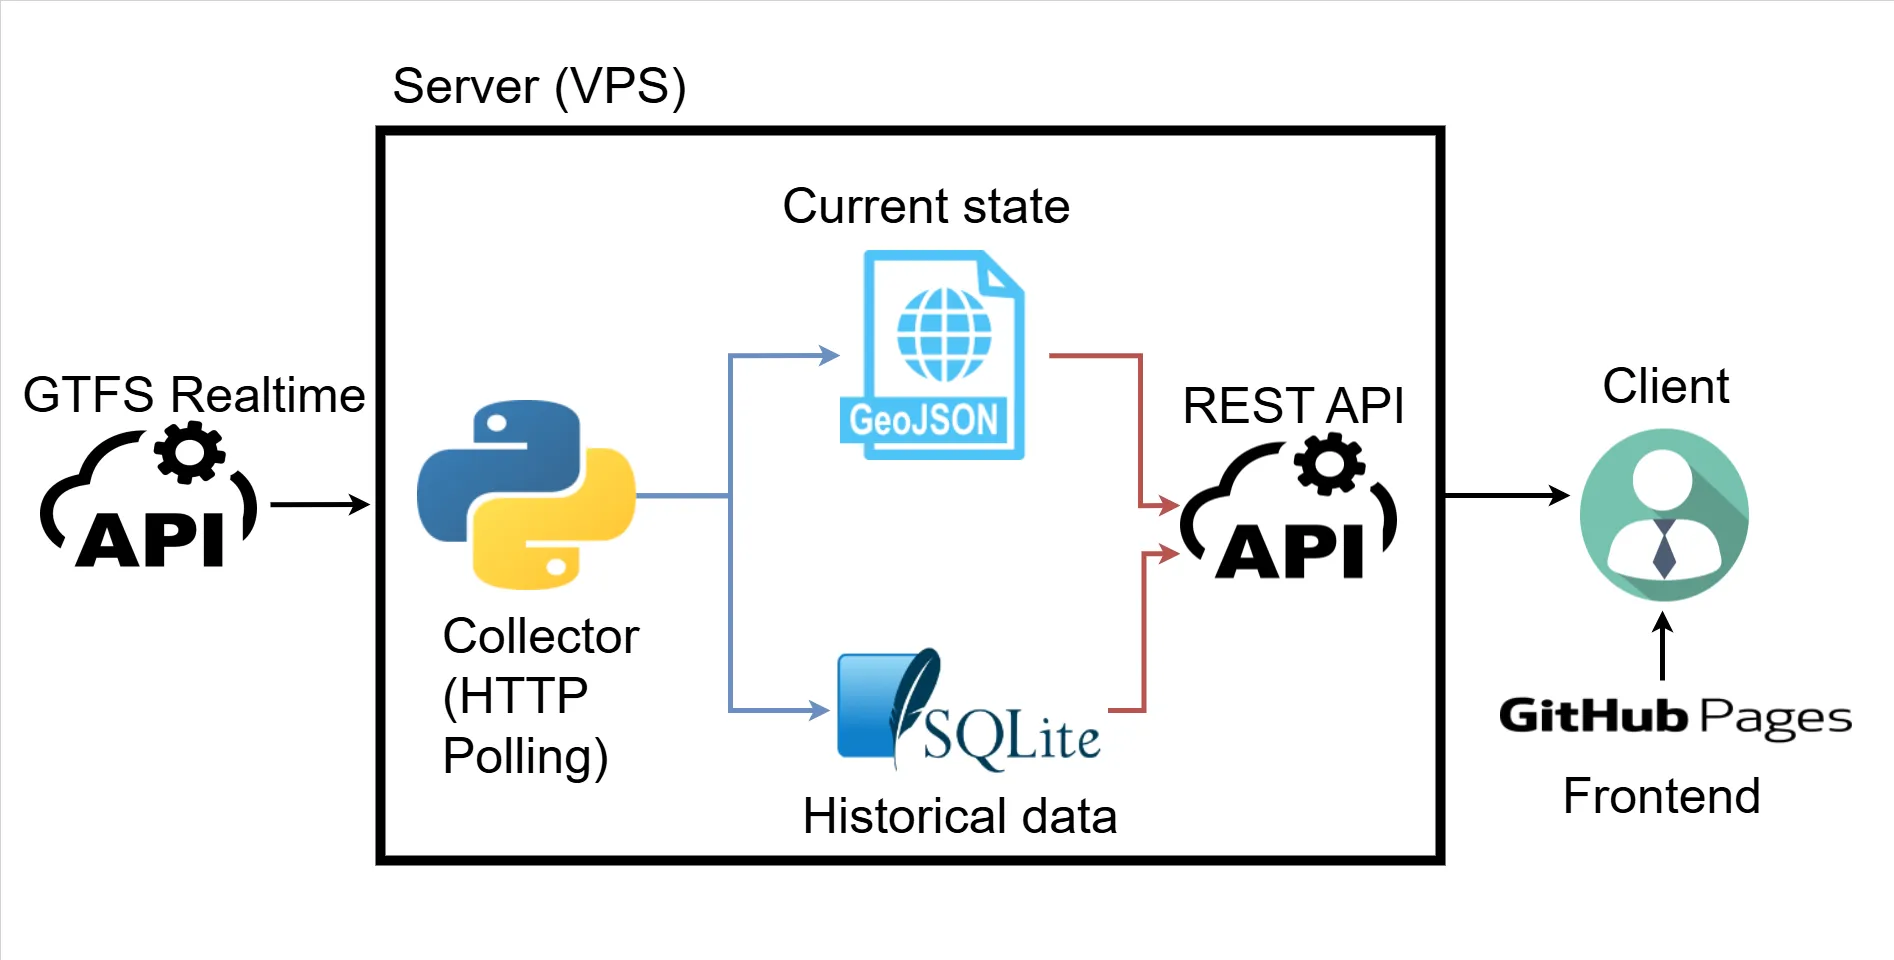
- A collector process polls GTFS-Realtime feeds (HTTP polling), parses protobuf, and:
- writes JSON snapshots like
vehicles.json,arrival_times.json(the current state/snapshot) - stores delay events into SQLite (the historic state)
- writes JSON snapshots like
- An API exposes those files and a few aggregated endpoints for the UI
- A frontend (Leaflet + OSM tiles) reads the snapshots and renders the dashboard The key idea here (and it shows in the log around mid-February) is: don’t query the database for realtime map refreshes. Just write a “latest snapshot” JSON file and serve it. SQLite stays for analytics/history.
Things That Didn’t Work (or at least weren’t as easy as they sounded)
I went into this thinking “I know what GTFS looks like, I’ll just parse it and draw a map.” Reality check: I didn’t know how this specific feed behaved in practice (update frequency, missing fields, timing drift between feeds, whether stops disappear, etc.). So before committing to any “delay algorithm”, I wrote small experiments and watched the feeds for real. Those tests (especially the lingering tests in LOG.md) led to a few conclusions that basically dictated the design:
- The feeds update roughly every ~100 seconds, and different feeds aren’t always perfectly synchronized.
- Data isn’t perfectly “clean”: entities can disappear, reappear, skip stops, or change platform IDs.
- If I wanted something reliable, I had to build around what the data actually does, not what the spec suggests it could do.
1) “Realtime” wasn’t really realtime
The lingering tests made this super clear: feeds update ~every ~100 seconds and the positions are often 2–3 minutes behind what you see on official tools. That changed expectations: the dashboard is accurate-ish, but not “subway control room” accurate.
2) VehiclePosition isn’t enough for delays
VehiclePosition tells you “here’s the GPS, here’s a stop_id-ish reference”, but not reliable arrival times. TripUpdates does give stop-level predicted times, so the delay logic centered around TripUpdates + scheduled stop_times.txt.
3) Scheduled vs realtime time systems are different
Static stop_times.txt uses service day times (HH:MM:SS, even >24h). Realtime uses epoch seconds. So you have to map:
start_date(service date) + agency timezone
to- “midnight epoch” + scheduled seconds-of-day
That logic became the foundation of delay calculation in
apps/collector/src/collector/gtfs_to_json.pyvia helpers like_service_midnight_epoch(...)and_convert_hhmmss_to_epoch(...).
4) Stops can “change” because platforms change
A fun real-world issue: stop IDs sometimes include platform suffixes (ME2 vs ME1). Scheduled data might list one, realtime might send another. That’s why the code ended up using a “same base stop, different platform” fallback.
Iterations & Improvements: how it got better over time
The collector grew up: retries, backoff, and “only process when feeds update”
The collector got shaped into an idempotent polling loop:
- fetch snapshots
- retry a bounded amount if timestamps didn’t advance
- exponential backoff on repeated failures
- only run “processing” when there’s new data
Delay detection: “a stop was reached when it disappears”
One of the cooler insights from the lingering tests: when a vehicle reaches a stop, that stop often disappears from TripUpdate’s stop_time_update list in the next snapshot or two.
So delay events are detected like this:
- Compare previous trip feed dict vs current trip feed dict
- For stops that existed before but not now → treat that as “we reached it”
- Compute delay (realtime vs planned) and store it to SQLite
And to avoid duplicate inserts / weird reappearance behavior, the collector only treats a trip as “fully finished” when it disappears and only the last stop remains (the tradeoff is: you might miss some stops, but you keep the dataset clean).
Logging: the “prints are fine until they aren’t” refactor
Once the collector was running continuously, print() wasn’t enough. The code moved to logging with RotatingFileHandler so logs don’t grow forever:
maxBytes=800_000backupCount=3inapps/collector/src/collector/collector.py. And logs were standardized with prefixes likeS=<script> F=<function> ..., which makes debugging a lot less annoying when everything is just “some loop in a container”.
API: thin file-serving plus two aggregation endpoints
The API stayed intentionally simple:
- serve
vehicles.json,arrival_times.json,stops.json,shapes.json - query SQLite for:
/top_routes/top_stopsinapps/api/src/main.py.
The frontend is in charge of calling this API.
Closing Thoughts: where it ended up, and what’s next
At the end of this, I basically ended up with a clean little “mini platform”:
- Python ingestion of GTFS-Realtime protobuf feeds (HTTP polling) + JSON snapshot generation
- A SQLite historical table for delays + simple aggregations
- A small FastAPI layer to serve “current state” and “top delays”
- A Leaflet + OpenStreetMap frontend that stays lightweight and does the rendering and filtering
- Everything containerized with Docker / Docker Compose, so running it elsewhere is mostly “clone + docker compose up —build”
At this point, the project has two “faces”:
apps/: the real system (collector + API + frontend) that can run with Docker Composedocs/: the GitHub Pages demo version (no backend) If I eventually decide it’s worth paying for a VPS, the deployment steps are basically what you wrote in the log (22/03/2026), but with a clearer order:
- Make the API secure (SSL/HTTPS, rate limiting, CORS locked to your frontend origin)
- Switch the deployed frontend from static demo data back to API calls
(i.e., replacedocs/index.htmlwith theapps/frontend/index.htmlversion, or run a proper webserver container on the VPS) - Deploy with Docker Compose:
docker compose up --build
Why the GitHub Pages demo loops (and why that’s intentional)
GitHub Pages can only host static files—no Python collector, no FastAPI, no SQLite queries. But the dashboard is mostly “read JSON, draw map, refresh vehicles”. So instead of paying for a VPS just for this project what I did was:
- Run a special script (
apps/collector/src/collector/collector_compile.py) to record 41 snapshots of vehicles and arrival times - Make
docs/index.htmlload:- static:
docs/data/stops.json,docs/data/shapes.json,docs/data/top_routes.json,docs/data/top_stops.jsononce - “realtime”: every 40 seconds, increment frame number
0→40, then wrap to0That’s the “loop”: it’s not live data—it’s a prerecorded reel that makes the page feel realtime while staying fully static.
- static: